Originally published in php[architect] Magazine, March 2019 issue. [PDF] and discussed in Building Bridges (podcast), php[podcast] – The Official Podcast of php[architect], March 25th 2019. [Official Link] [Local Copy]
Thanks to Taylor Otwell’s Laravel framework, PHP is reclaiming its rightful place as the go-to language for web application development. For those of us maintaining and developing applications using legacy frameworks, the grass certainly looks greener on Laravel’s side. In this article, I will show you how to do an in-place migration from a legacy framework to Laravel.
Introduction
IXP Manager is an open source tool we developed at INEX for managing IXPs (internet exchange points – network switching centers which facilitate the regional exchange of internet traffic between different networks). It has run on Zend Framework V1 (ZF1) since 2008.
As most readers will know, ZF1 went end-of-life in 2016, but its obituary was written a couple years before that. In 2015, we released V4 of IXP Manager which was a framework transition release. Over the course of nine minor releases of V4, we migrated from ZF1 to Laravel finally completing the project with V4.9 released in January of 2019.
Admittedly, a two and half year transition sounds like a long time but this was an in-place migration where Laravel handled new and migrated controllers while anything still to be migrated fell back on ZF1. You should also note the IXP Manager project has a single full-time developer plus me when time allows.
The Approach
There are two possible approaches to migrating your application to Laravel: a flag-day or an in-place/side-by-side migration.
Your gut feeling may lean towards a flag day – let’s just get this done” – but it is the more drastic path. It means pausing all feature development and rewriting the application completely. In any project, commercial or open source, this is a very difficult argument to make. For a commercial project, it puts a real cost on the migration: ( number of developers * monthly salary * n months ) + the opportunity cost of the development freeze where n will realistically be six months at an absolute minimum. This will be very difficult to get approved by the higher-ups! Plus, have you ever met a development project that finished on time? That six months will creep to a year and even beyond very quickly.
With the in-place migration, we add Laravel to our application so that it has the first opportunity to service a request (route). Otherwise, it hands off to the legacy framework. This has two immediate advantages: you can develop all new features immediately on Laravel as well as use Laravel features and facades within the legacy framework. It also means you can migrate legacy controllers on a case-by-case basis as time and resources allow. Migrating the smaller/easier legacy controllers are also excellent projects for interns, student work experience or new hires getting up to speed. The true cost is buried in day-to-day development, there’s no promised flag-day deadline to miss, and there’s no frustrating feature freeze.
Making the Case
Part of making the case to fellow developers and decision makers in your organization is being able to reference that Laravel is now the number one web application framework on GitHub – across all languages. Other important arguments include:
- Prevent developer apathy: or, better phrased for management, retain key employees and attract more developers. Let’s face it, as developers, we prefer to engage in projects that use current frameworks and which support modern versions of PHP (i.e., greater than or equal to 7.1).
- You will have to eventually: this is a corollary of the above point. If you do not migrate to a modern framework, then you will inevitably face each of the following consequences. You will hemorrhage employees/developers, and your code will grow more outdated and consequently prove more difficult and costly to upgrade eventually. You’ll be running on frameworks that have passed end-of-life and end-of-support which means security holes will be discovered but remain unpatched and you’ll be forced to run older operating systems to run older versions of PHP for framework compatibility yielding yet more known but unpatched security holes.
- Develop with modern techniques and services: Laravel makes it incredibly easy to use modern features such as job queues, an integrated command line interface, broadcasting, caching, events with listeners, scheduling, modern templating engine, database abstraction and ORM, and more.
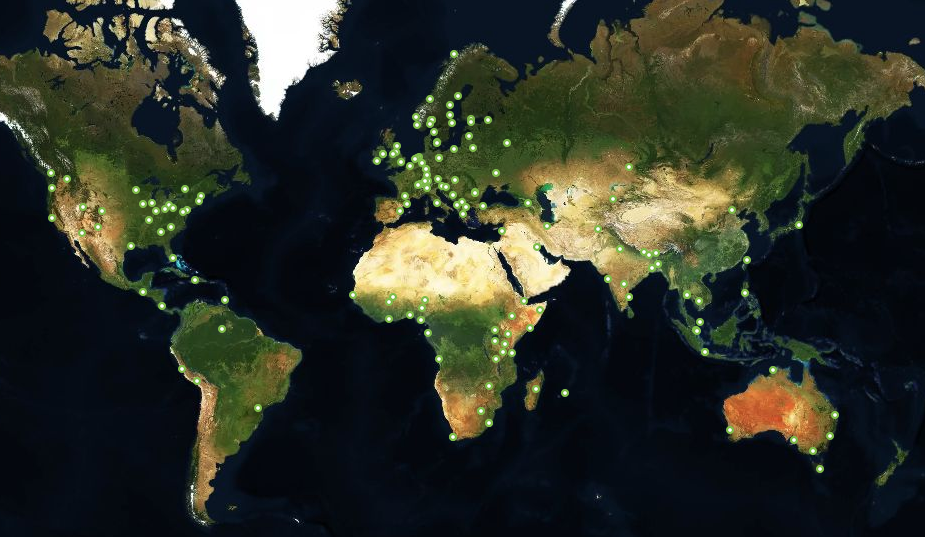
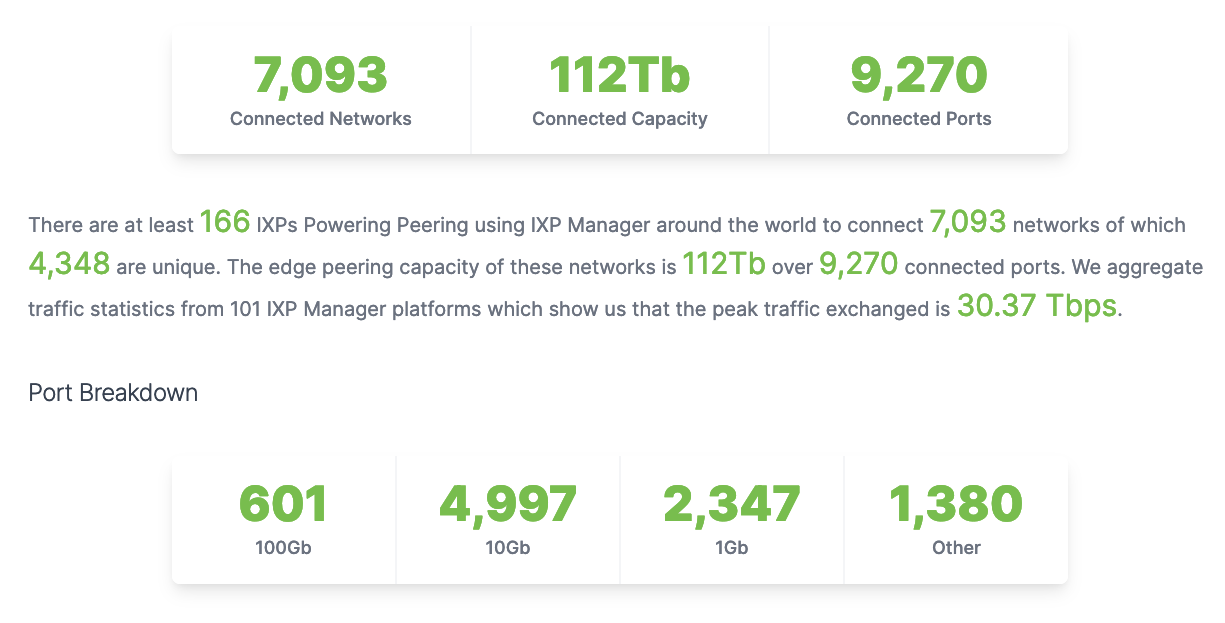
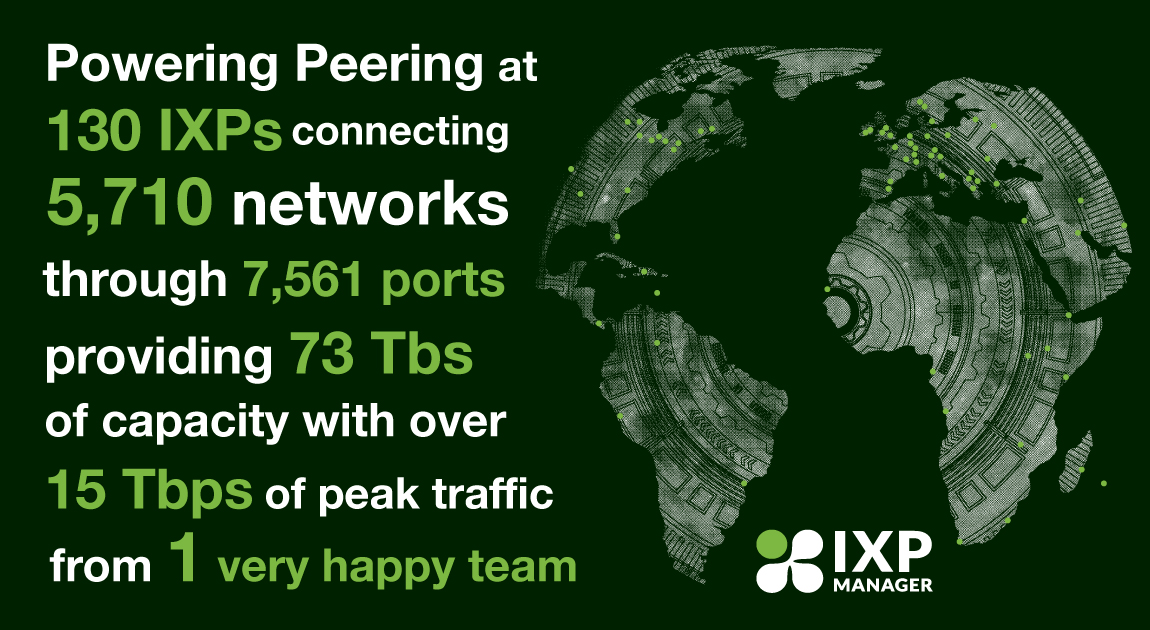
- Reference applications: refer to projects that successfully demonstrate an in-place migration including IXP Manager which supports critical internet infrastructure in 70 locations around the world and has successfully completed the migration, and LibreNMS, a hugely popular network monitoring system with thousands of installations that is also well along the path of replacing a custom framework with Laravel.
Prerequisites
Before you start the process of integrating Laravel for an in place migration, you need to ensure your existing application is ready for it.
Your legacy application needs to use Composer, a dependency manager for PHP. If you are not using it already, it will need to be integrated into your application by using autoloaders (classmap, psr-0/4) for existing namespaces (whether modern PHP namespaces or the Zend_ type prefix).
Your application should have a single point of entry (e.g., index.php). If it doesn’t, you can create an index.php to handle this by (carefully and securely) examining the $_REQUEST object and running the requested script from a new index.php.
Your application entry point should exist in a dedicated subdirectory such as public/ – i.e., the framework and other PHP files should not be exposed by your web server. This should be fairly easy to retrofit if not already in place.
The Migration
Step One: Install Laravel
The first step is to install the Laravel application base files alongside your existing application files. Begin by installing Laravel using its own documentation into a separate directory and then move the files over to your application root directory in a piecemeal fashion.
You will need to resolve any filename or directory conflicts, and you should do this by moving your own files out of the way and renaming or refactoring them rather than altering Laravel’s files. The level of effort here will be framework dependent, but the good news is it was very easy for ZF1. I also looked at the file and directory structures for CodeIgniter and Symfony, and both also seem like they shouldn’t pose any significant problems. Lastly, if you are running a custom or non-application framework (LibreNMS was in this category), you will still be able to use the technique I am demonstrating here. Continue reading and pay particular attention to moving but keeping your index.php in step two below.
When you complete the file moves as shown by example in Listing 1, examine any files remaining in the Laravel directory and move them if necessary/desired. Also, note the example was based on Laravel v5.7 so your mileage may vary for other versions.
# Get the Laravel files from GitHub:
git clone https://github.com/laravel/laravel.git

# Switch to the version of Laravel you want to migrate to:
cd laravel
git checkout vx.y.z

# Assuming you are in the new Laravel app directory above
# and your legacy application is located at ../legacyapp

# You can start to move the files as follows (and feel free
# to break this into smaller steps if there are conflicts):
mv app/ artisan bootstrap/ config/ database/ package.json \
   phpunit.xml resources/ routes/ server.php storage/     \
   tests/ webpack.mix.js    ../legacyapp

mv .env.example ../legacyapp/.env
mv public/js/app.js ../legacyapp/public/js
mv public/css/app.css ../legacyapp/public/css

# For now, we ignore public/index.php and we do not need
# any of composer.json, readme.md, vendor/ or CHANGELOG.md
As well as the base Laravel files, you also need the actual Laravel framework and supporting packages. Integrate the lines shown in Listing 2 to your composer.json file (ensuring you match this to your version of Laravel).
{
    "require": {
        "fideloper/proxy": "^4.0",
        "laravel/tinker": "^1.0",
        "laravel/framework": "5.7.*"
    },
    "require-dev": {
        "beyondcode/laravel-dump-server": "^1.0",
        "filp/whoops": "^2.0",
        "fzaninotto/faker": "^1.4",
        "mockery/mockery": "^1.0",
        "nunomaduro/collision": "^2.0",
        "phpunit/phpunit": "^7.0"
    },
    "autoload": {
        "psr-4": {
            "App\\": "app/"
        },
        "classmap": [
            "database/seeds",
            "database/factories"
        ]
    },
    "autoload-dev": {
        "psr-4": {
            "Tests\\": "tests/"
        }
    }
}
You should now run composer update to install Laravel and its dependencies. You should also examine the other sections of Laravel’s composer.json file including the config, extra, and scripts sections and copy them across.
Before you proceed any further, you should check that your legacy application continues to work as expected. While we have installed Laravel’s files and supporting libraries, we have not changed index.php so your application should run as it always has. If you have integration tests, they can really shine here. If you don’t, consider writing them as you port functionality over to Laravel. Diagnose and fix any issues now.
Step Two: Activate Laravel as the Default Framework
You need to verify you successfully completed Step One. To do this, move your index.php out of the way (e.g., mv index.php legacy_index.php) and copy over Laravel’s own index.php to replace it. Ensure Laravel starts up instead of your own legacy application. If it works, you will see the standard Laravel application welcome page. If this does not work, diagnose and fix those issues now.
When finished, leave Laravel’s index.php in place. The handoff to the legacy framework will happen within the Laravel application and not index.php.
Step Three: Hand Off to Legacy Framework
There are two ways to hand off to the legacy framework I have seen in use: the way we did it with IXP Manager via a 404 error handler and the way LibreNMS did it using a catch all route. I will show you both methods here, and you can choose which suits you.
Using a 404 Handler
In Laravel, if a route does not exist to handle a request, it throws a 404 exception. In Laravel v5.7, this gets handled in app/Exceptions/Handler.php:
class Handler extends ExceptionHandler {
    // ...

    public function render($request, Exception $exception)
    {
        return parent::render($request, $exception);
    }
}
We augment this render() function to handle 404 exceptions differently by handing them off to the legacy framework – here’s a skeleton example.
use Symfony\Component\HttpKernel\Exception\{
    NotFoundHttpException };

public function render($request, Exception $exception) {
   if( $exception instanceof NotFoundHttpException ) {
      // pass to legacy framework - contents of index.php
      die();
   }
}
Before we fill in the detail of pass to legacy framework contents of index.php above, we need to decide how to actually handoff. We could just jam in the contents of legacy_index.php and it would work fine. But as we migrate more and more elements to Laravel, we’ll find various complications that make this unwieldy. A better way to handle the legacy framework within Laravel is to treat it as a service provider. For example, we could create a file app/Providers/ZendFrameworkServiceProvider.php as shown in Listing 3.
class ZendFrameworkServiceProvider extends ServiceProvider{
protected $defer = true;
public function register() {
$this->app->singleton("ZendFramework",function($app){
// here are the contents of the legacy index.php:
require_once “Zend/Application.phpâ€;
$zf = new Zend_Application(
$app->environment(), $this->createOptions()
);
return $zf->bootstrap();
});
}
}
IXP Manager’s actual production version of this can be seen here in our v4.8 GitHub tree. You should note we have completely removed Zend’s own configuration INI files at this point and instead take the configuration directly from Laravel’s config/ files. This is then passed into the legacy framework as an array. Our application only has one configuration mechanism (more on this later).
Also, to make require_once "Zend/Application.php" work, we installed the ZF1 library via Composer. As mentioned above, you can use classmaps, psr-0, or psr-4 within Composer to ensure Laravel can resolve your legacy application’s namespace.
Do not forget to register the new service provider in config/app.php:
   'providers' => [
      // ...
      App\Providers\ZendFrameworkServiceProvider::class,
      // ...
   ],
Now that we have our legacy framework service provider, we can return to the 404 exception handler’s (app/Exceptions/Handler.php) render() function and fill in the missing piece:
// Render an exception into a HTTP response
public function render( $request, Exception $exception ) {
  if( $exception instanceof NotFoundHttpException ) {
    // pass to legacy framework
    App::make("ZendFramework")->run();
    die(); // prevent Laravel sending a 404 response
  }
}
There are some great advantages to using a service provider and putting Laravel first:
- You can use all of Laravel’s facades immediately in your legacy code (e.g.,
Cache::, Queue::, Mail::, etc.). - You
can migrate code on an action by action basis rather than controller by
controller or even have Laravel handle new action based requests for
existing legacy controllers.
- you can eventually cleanly and simply remove the legacy framework by removing the 404 handler lines, the entry in
config/app.php, legacy related packages from composer.json, and the legacy service provider.
Using a Default Route
This is how the LibreNMS project handled the side-by-side migration. At the end of Laravel’s routes/web.php file, they added:
// Legacy Framework Routes
Route::any( "/{path?}", "LegacyController@index" )
    ->where( "path", ".*" );
This catches all routes not having a specific previous match in Laravel in the same way the 404 handler does. They then hand off to to the legacy framework in a controller (app/Http/Controllers/LegacyController.php) as follows:
namespace App\Http\Controllers;
class LegacyController extends Controller {
    public function index($path = "") {
        ob_start();
        include base_path("html/legacy_index.php");
        return response( ob_get_clean() );
    }
}
This will also work, but be aware you’ve entered Laravel’s HTTP kernel handling, and loaded and run all middleware associated with the web routes. This can be useful in some circumstances, but the 404 handler method will generally be more efficient.
Continuing the Migration
You can now proceed with the migration on a controller by controller basis (or action by action) along with the views and models as necessary.
Other Considerations
Parallel Configurations
For our own project, our users download, install, and maintain it themselves. As the in-place migration went on for two years, it would have been completely unreasonable – and downright confusing – to ask those users to configure and maintain settings in two different places and using two different methods (ZF1’s application.ini file and Laravel’s .env).
Instead, we chose to configure everything in Laravel from the beginning. In our ZendFrameworkServiceProvider we then build an array using Laravel’s config() function in the same format ZF1 would have when reading the application.ini file. This array is then passed as a parameter when instantiating the legacy service provider. We already provided a link to the production version of this file in GitHub above.
If your application is an in-house enterprise system or a cloud-based hosted service, this may not be an issue for you. But if you expect your end users to install and configure the application, switching to use Laravel configuration only and passing that to the legacy framework is definitely the developer-friendly choice.
Session Management
I was quite worried about this one from the outset and had nightmares of the legacy framework and Laravel tripping over each other in PHP’s default session management system. Then, I discovered these comments within Laravel’s session middleware framework files:
// If a session driver has been configured, we will need to
// start the session here so that the data is ready for an
// application. Note that the Laravel sessions do not make
// use of PHP "native" sessions in any way since they are
// crappy.
I won’t start an argument on whether the statement is true or not, but from a migration point of view, it’s a really useful position for Laravel to take. Essentially, as Laravel implements its own cookie-based session management system, there are no conflicts with any other legacy frameworks. It essentially just works.
If you need to access the Laravel session in your legacy code, you can use the Session:: facade.
User Authentication
Frameworks typically handle user authentication using sessions. As Laravel has its own session management system, our goal is to ensure when a user has logged into one framework, they are logged into the other framework (and same for logging out).
We choose to leave the migration of the authentication controller until last – there was no particular reason for this, but it was going to be the first thing we did or the last. In the end, we just felt it was one of the more complex systems, and it would be easier to start with some of the simpler controllers. This meant we needed to ensure we logged into Laravel if we were logged into ZF1 (and logged out as appropriate).
There are a few ways (and places) to handle this. We chose to add a block of temporary code to the top of routes/web.php as it is executed on every request and it is a file that is edited regularly so we could be confident we would also remember to remove it when the migration was complete. It looked like this:
if( php_sapi_name() !== "cli" ) {
    $auth = Zend_Auth::getInstance();
    if( $auth->hasIdentity() && Auth::guest() ) {
        Auth::login( App\User::findOrFail( $auth->getId() ) );
    } else if( !$auth->hasIdentity() ) {
        Auth::logout();
    }
}
First, we do not run the code if we are running on the CLI (e.g., an Artisan command).
The if() statement says if we are logged into ZF1 and not Laravel, then log into Laravel. Conversely, the else if() asks if we are not logged into ZF1 then ensure we are also not logged into Laravel.
When the time comes to plan the migration of the authentication system, it is an opportune moment to consider other enhancements including:
- integrate
Laravel Socialite which allows users to log in with OAuth providers
such as Facebook, Twitter, LinkedIn, Google, GitHub, GitLab, and many
more;
- add 2-factor authentication;
- add Log in As functionality which is useful for diagnosing issues as end users see them (see the
viacreative/sudo-su package for a good example of this); - and, of course, upgrade password hashing to bcrypt/Argon2.
Duplication of Views/Templates
One of the more significant headaches of an in-place migration is having to duplicate your layout views (menus, headers, footers, etc.) and maintain both versions during the process. When you do this, you will want to keep the new Laravel view template layouts as close to the legacy ones as possible. This ensures your end users will not realize two frameworks are running the backend.
This doesn’t mean you can’t modernize the frontend libraries. For example, you could still upgrade from Bootstrap v2 to Bootstrap v4 and smooth out the differences with custom CSS.
Also, as you migrate actions and controllers, don’t forget to update links in both sets of views.
ORM/Database Model Migration
Laravel has a very nice ORM called Eloquent. It also has its own DBAL (database abstraction layer) on which Eloquent is built. As you migrate the legacy application, you will also need to consider how best to migrate the legacy database code.
If you have been using PHP’s mysql_* functions directly or have built up a custom library to wrap the usage of these functions, you should just bite the bullet and move to Eloquent as you migrate.
Our situation with IXP Manager was a little different as we migrated to Doctrine2 in 2012 so we were already using a high-performance modern ORM library. Rather than try and migrate this, we were fortunate the Laravel Doctrine project provides a drop-in Doctrine2 implementation for Laravel 5+. This allowed us to use our Doctrine entities and repositories in both the legacy and Laravel framework in parallel.
Tracking Progress
This is accomplished by watching the number of legacy controllers (or files) you still have to reduce with each iteration. As each action/controller is migrated, the legacy code should be removed. This is accompanied by a nice endorphin release when you commit and push deletions of legacy code!
The typical decision to migrate a controller was either:
- no pressing feature requests so pick off the next controller and migrate it; or,
- there
was a required new feature in a legacy controller, so the feature was
implemented in Laravel as part of the process of migrating the
controller.
About 18 months into the IXP Manager migration project, we estimated we were about 75 percent of the way to removing ZF1. The remaining legacy controllers were static code which were rarely touched. To bring it over the line, we put two months of concentrated effort into this while still not neglecting other smaller improvements, bug reports, and feature requests.
Summary
This article is a write-up of a talk I gave at the Laravel Live UK conference in 2018. Let me close with some encouragement: while migrating a large application to a new framework is a daunting and time-consuming task, it is possible. IXP Manager has roughly 85k lines of PHP code, and we got through it with a single full-time developer in a little over two years while still adding and improving features.
Please feel free to reach out to me on @barryo79 with comments and questions.